My Inquiry
 My Account


A Texas Instruments customer pricing letter dated September 1, 2026 gives advance notice of upcoming price adjustments across products in the company's portfolio. TI does not provide one percentage increase, a complete affected-part list or a new company-wide effective date. It says the adjustment will vary by product according to the materials, technologies and manufacturing processes involved.
That makes the latest notice different from a conventional price-increase announcement. The practical issue is no longer whether TI has raised prices three times or four times during 2026. Customers now need to follow pricing at individual MPN level, because two devices in the same broad product category may receive very different adjustments.
The timing also deserves attention from readers following the broader semiconductor cycle. TI entered the second half of 2026 with revenue up 23% year over year, operating profit up 48%, strong growth in Analog and Embedded Processing, and Industrial, Data Center and Automotive leading the recovery. At the manufacturing level, the company continues to shift more output toward its lower-cost 300mm production base while approaching the end of a multi-year elevated capital-spending cycle.
None of those factors proves that the September pricing action will translate directly into higher margins. Together, however, they describe a different operating environment from the inventory-correction period that preceded the current recovery. The useful question for buyers and industry observers is whether stronger volume, product-level repricing and improving manufacturing economics continue to move in the same direction through the rest of 2026.
What TI Actually Says in the September 1 Pricing Letter
The letter, signed by Mark Roberts, Senior Vice President of Worldwide Sales and Marketing, says upcoming price adjustments will affect products across TI's portfolio. TI attributes the changes to market dynamics and rising costs throughout the supply chain, while making clear that the effect will differ by product.
The wording is specific about how those differences will be determined. Materials, process technologies and manufacturing methods can all influence the final adjustment. That is important for TI because its product portfolio spans power-management ICs, amplifiers, data converters, interface products, microcontrollers, processors, isolation devices, sensors and many other analog and embedded components built through different wafer and packaging routes.
TI also says customers will receive product-specific details and automated price-change notifications through their account dashboards. Pricing management is therefore moving closer to the individual customer and individual MPN rather than being communicated only through a single portfolio announcement.
Source: Texas Instruments customer pricing letter dated September 1, 2026.
Is This TI's Fourth Price Increase of 2026?
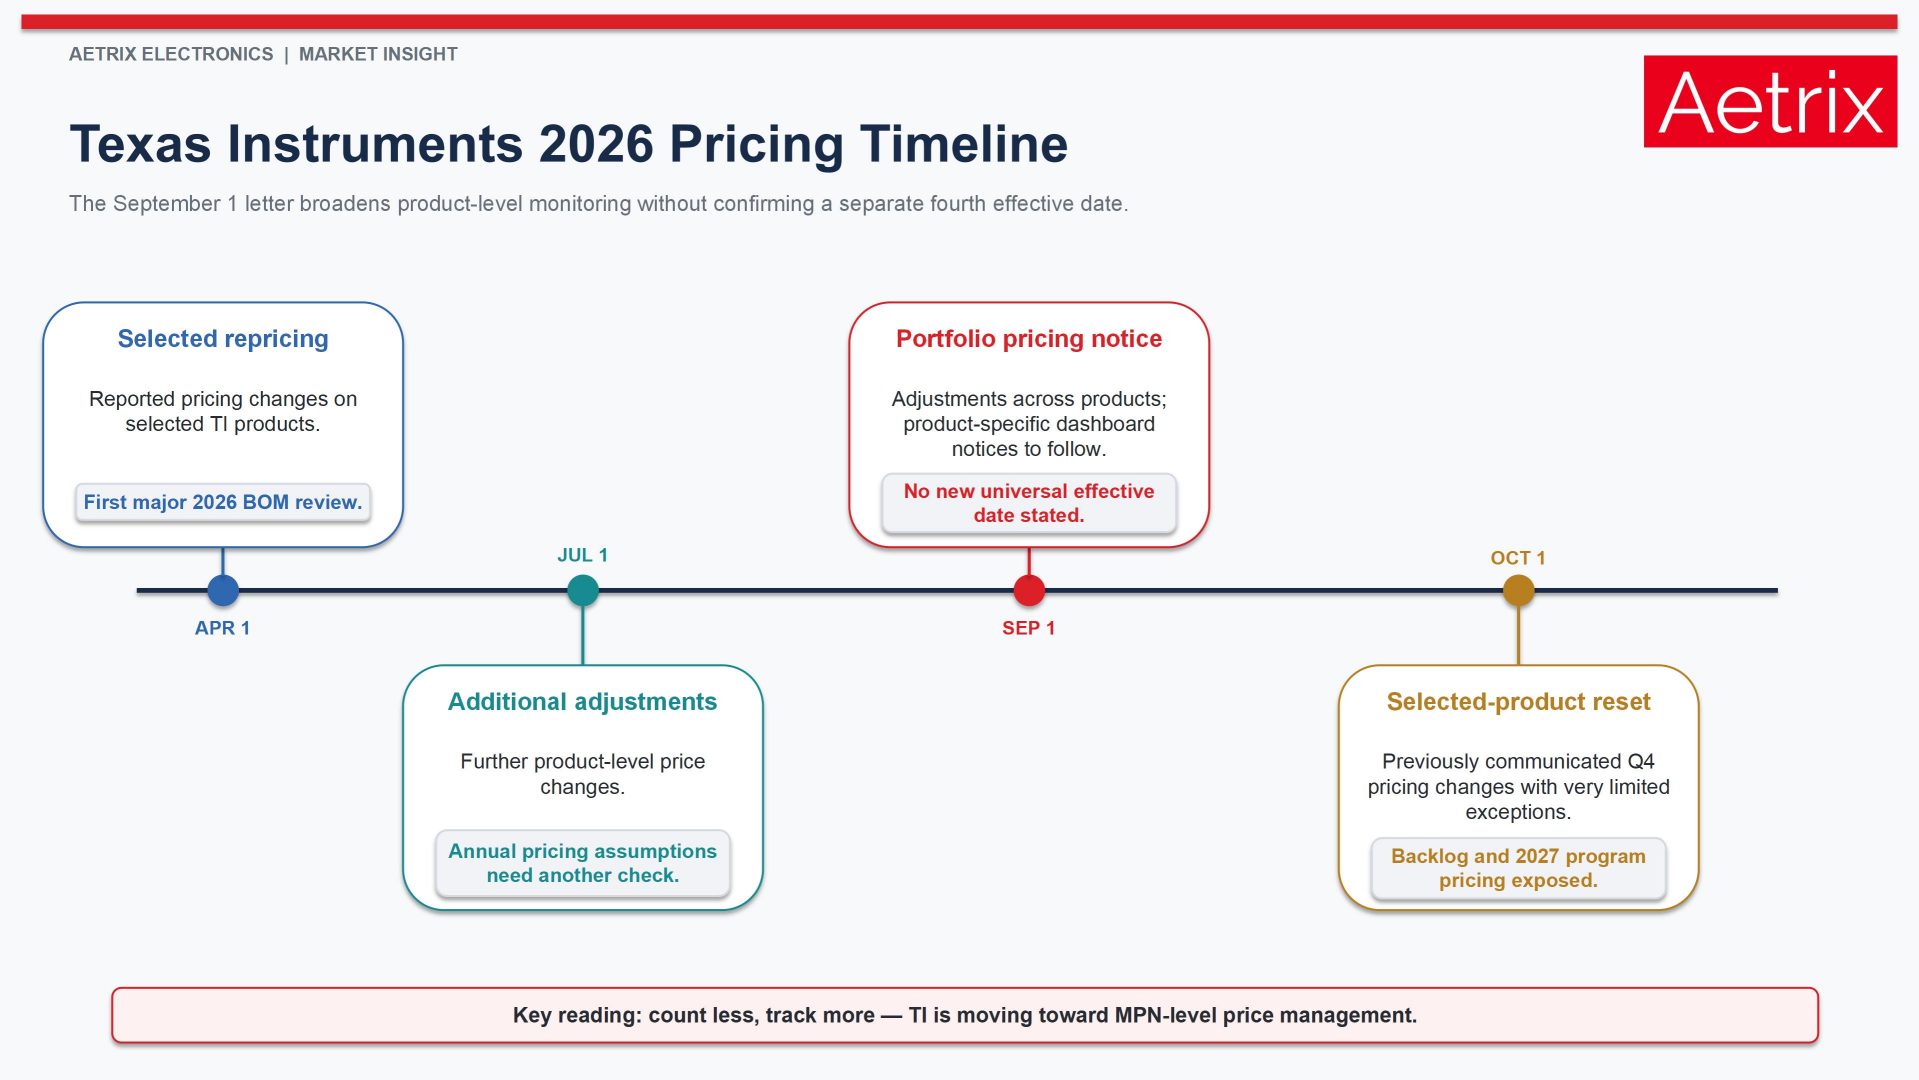
There is not enough information to classify the September 1 letter as a confirmed fourth independent price increase. The letter does not state a new effective date and does not say that its adjustments are separate from the October 1 pricing changes already communicated to some customers.
Aetrix has previously tracked TI pricing changes associated with April 1, July 1 and October 1. The October communication covered selected products and indicated that pricing exceptions would be extremely limited. The September letter uses broader portfolio language, but product-level notifications are still needed before the relationship between the two communications can be determined. Our earlier article covers the Texas Instruments October 2026 price adjustment in detail.
| 2026 Pricing Signal | What Was Communicated | What Buyers Need to Check |
|---|---|---|
| April 1 | Reported pricing changes on selected TI products | Affected MPNs and revised project cost |
| July 1 | Additional product-level adjustments | Whether earlier annual pricing remained valid |
| October 1 | Selected products; exceptions expected to be very limited | Q4 shipments, backlog and 2027 contract exposure |
| September 1 letter | Advance notice of adjustments across products in the portfolio; product details to follow | Dashboard notifications, exact MPNs, effective dates and existing-order treatment |
The Important Change Is Not the Number of Price Increases
The September letter points toward a more continuous form of product-level price management. TI explicitly says that the adjustment varies with materials, technologies and manufacturing processes. A single percentage applied to "TI Analog" or "TI Power Management" would therefore be a poor proxy for the actual impact on a customer BOM.
A mature analog device manufactured on an older process can have a very different cost structure from a high-volume product already running on 300mm wafers. Automotive qualification can restrict the approved production route. Some devices require more expensive packaging, testing or isolation structures. Others may use mature processes with many years of accumulated manufacturing efficiency.
This is also why market reports describing a single TI percentage need to be treated carefully unless they identify the affected part numbers and commercial terms. A 15% adjustment on one group of legacy products does not establish what will happen to a newer 300mm power IC, an MCU or a high-volume data converter.
Demand Is Recovering While TI Resets Pricing
TI's second-quarter results provide a useful reference point. Revenue reached $5.463 billion, up 23% from Q2 2025 and 13% sequentially. Operating profit increased 48% year over year to $2.310 billion, while net income increased 53% to $1.980 billion. TI said the recovery was broad, led by Industrial, Data Center and Automotive. (Texas Instruments, Q2 2026 Financial Results)
The improvement was visible in both major businesses. Analog revenue increased 26% year over year to $4.365 billion and Analog operating profit rose 50%. Embedded Processing revenue increased 16% to $788 million, while segment operating profit increased 98%. TI guided Q3 revenue to $5.65 billion–$6.15 billion.
The price notice is therefore arriving during a recovery in shipments rather than during the weakest part of the previous inventory correction. That distinction does not prove pricing power on every product. It does mean that new prices are being introduced while customer demand and factory loading are moving upward.
| TI Q2 2026 | Result | What It Shows |
|---|---|---|
| Revenue | $5.463B, +23% YoY | Recovery is converting into shipments |
| Operating profit | $2.310B, +48% YoY | Profit grew substantially faster than revenue |
| Analog | $4.365B, +26% YoY | Strong recovery in TI's largest business |
| Embedded Processing | $788M, +16% YoY | Improvement extends beyond Analog |
| Q3 revenue guidance | $5.65B–$6.15B | TI expects another high shipment quarter |
TI also reported $8.7 billion of cash flow from operations and $6.5 billion of free cash flow for the trailing twelve months through Q2. Those figures do not come from the September letter, but they are useful when evaluating where TI is in its operating cycle because the recovery is appearing in revenue, profit and cash generation at the same time. (Texas Instruments, Q2 2026 Financial Results)
The Signal Is the Combination, Not the Price Letter Alone
A semiconductor manufacturer can raise prices for several very different reasons. A supplier facing severe input-cost inflation may increase prices simply to stop margins from falling. Another may reprice products because utilization is improving and customer demand has become less price-sensitive. Those situations can look identical in a customer notice and produce very different financial outcomes.
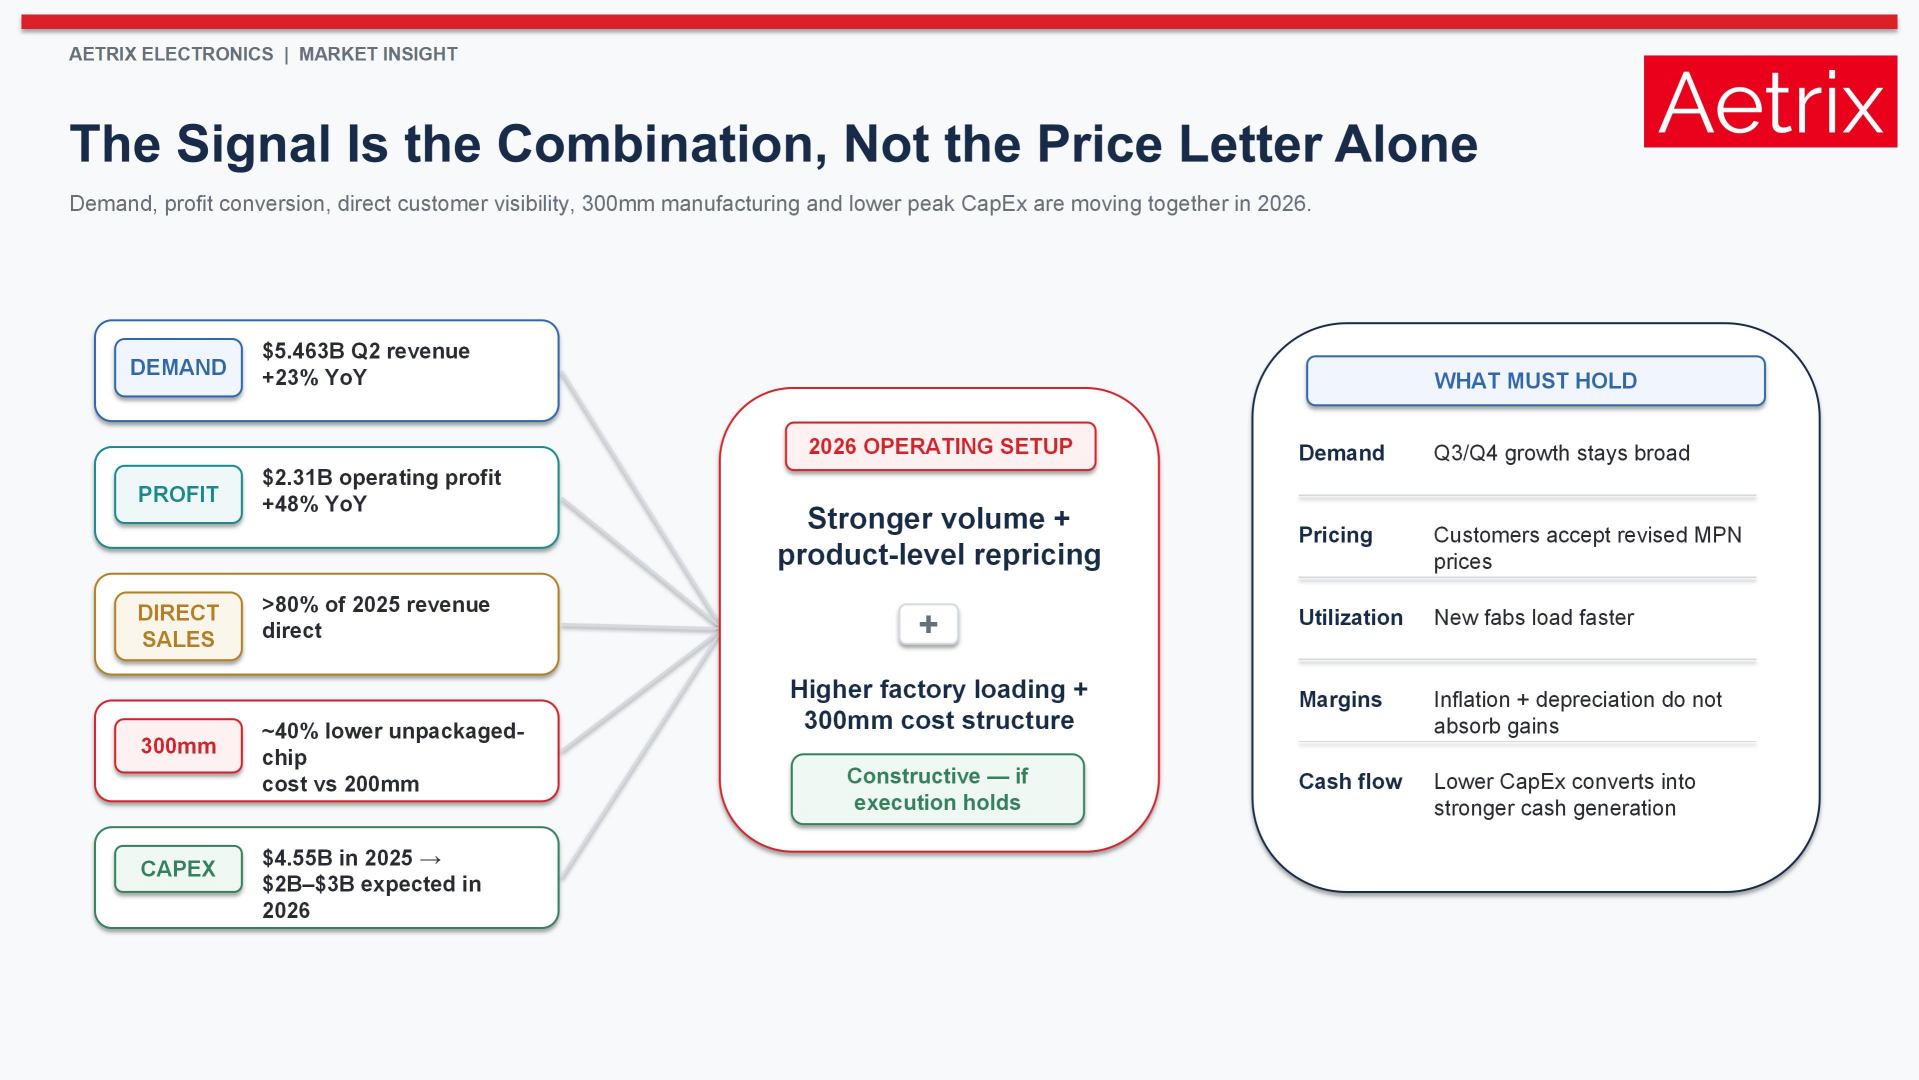
TI's September communication becomes more interesting when viewed beside the company's operating data. Revenue is accelerating, Industrial and Data Center demand are recovering, operating profit is growing faster than sales, direct customer relationships cover most of the business, and additional 300mm capacity is ramping. Product-level pricing is another variable inside that mix rather than a standalone conclusion.
| Operating Signal | Current Evidence | What Would Strengthen the Signal |
|---|---|---|
| Demand | Q2 revenue +23%; Industrial, Data Center and Automotive led growth | Q3 and Q4 growth remains broad rather than concentrating in one market |
| Pricing | Several pricing reviews during 2026; September notice moves toward MPN-level adjustment | Customers accept revised pricing without a material decline in order volume |
| Operating leverage | Operating profit +48% versus revenue +23% | Profit continues growing faster than sales after new pricing reaches shipments |
| Manufacturing | Additional internal 300mm capacity continues to ramp | Higher utilization spreads fixed fab costs across more units |
| Customer visibility | More than 80% of 2025 revenue was direct | Direct demand data allows production and pricing to respond faster to real customer consumption |
| Capital spending | 2026 CapEx expected at about $2B–$3B after $4.55B in 2025 | Revenue grows while annual fab investment moves below the peak buildout level |
This combination is more informative than the price letter by itself. It does not establish an earnings forecast, and it does not say where TXN shares should trade. It does show that TI's 2026 operating environment has moved away from the conditions seen during the earlier inventory correction. Future quarterly results can now be tested against these signals rather than judged from a pricing headline alone.
Direct Sales Give TI More Visibility Into Pricing and Demand
TI's route to market also affects how product-level repricing can be implemented. More than 80% of TI's 2025 revenue was direct, including TI.com. The company says these direct relationships provide better access to customer design activity and better knowledge of customer requirements. (Texas Instruments 2025 Form 10-K)
For pricing, that structure reduces the distance between the manufacturer and the customer. TI can see more of the actual design pipeline, order schedule and product usage while also communicating MPN-specific changes through its own account system. A distributor may still handle fulfillment for some customers, but the underlying pricing and demand information increasingly sits closer to TI.
This point was already visible in our analysis of TI's direct-sales strategy and 2026 revenue recovery. The September dashboard-notification language gives that strategy a new procurement dimension: direct customer infrastructure is now also part of price-change management.
TI's Manufacturing Economics Are Different From a Fabless Supplier
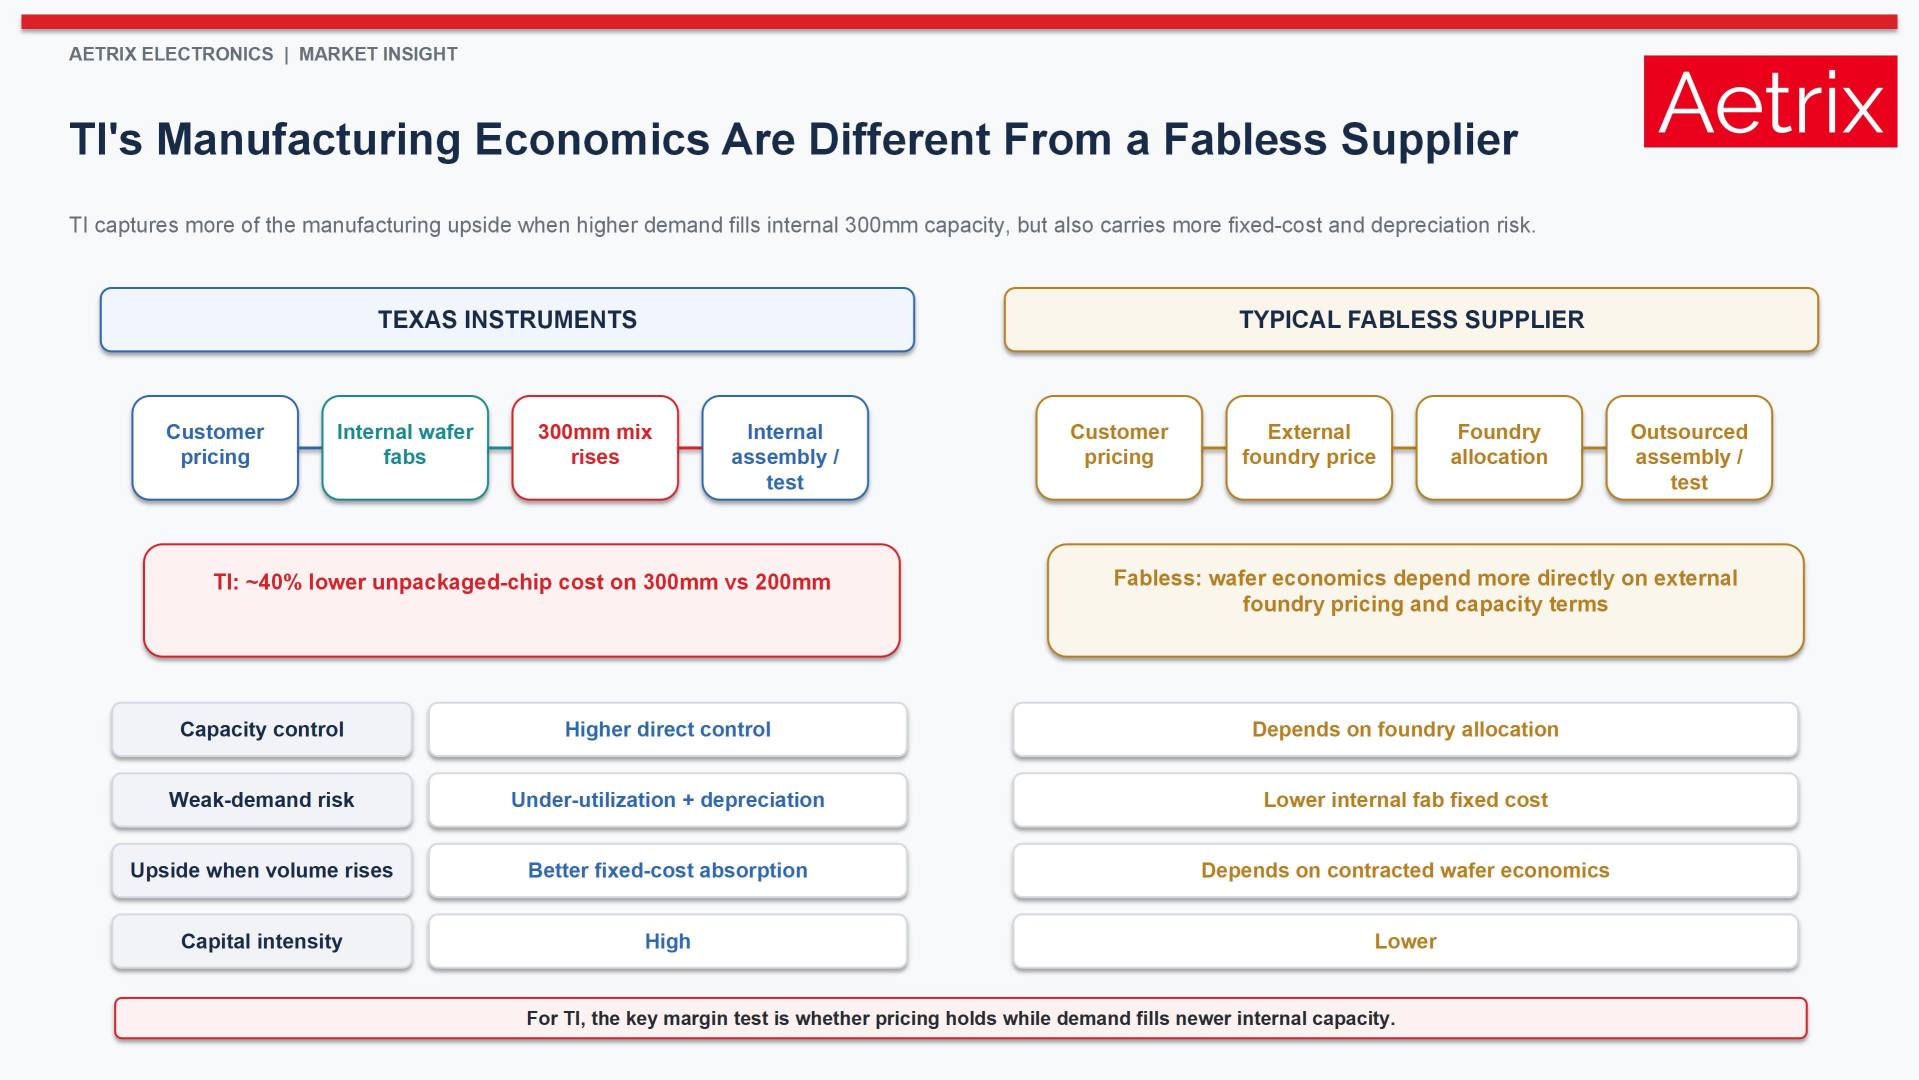
A TI price adjustment should not be interpreted through the same cost model used for a fabless analog or power-semiconductor supplier. TI owns wafer fabs and assembly/test facilities across several regions and performs most of its manufacturing internally. External foundries and subcontractors remain part of the network, but they are not the foundation of the business. (Texas Instruments 2025 Form 10-K)
For a fabless supplier, higher foundry pricing can transmit relatively directly into unit cost. The company purchases wafer capacity from an external foundry, absorbs a higher wafer price and then decides how much of that increase can be passed to customers. TI has another variable: internal factory utilization.
When demand is weak, an internally owned fab still carries depreciation and other fixed costs. When volume rises, those costs are spread across more units. If more of those units are also produced on TI's 300mm manufacturing base, the cost equation can improve further. TI says an unpackaged chip produced on a 300mm wafer costs approximately 40% less than an equivalent chip produced on a 200mm wafer.
| Manufacturing Factor | Texas Instruments | Typical Fabless Supplier |
|---|---|---|
| Wafer manufacturing | Mostly internal | Purchased from external foundries |
| Capacity control | Greater direct control over fab loading and long-term capacity | Depends more heavily on foundry allocation and contracts |
| Cost during weak demand | Under-utilization can expose substantial fixed manufacturing cost | Less internal fab fixed cost, although wafer commitments can still create exposure |
| Benefit when utilization rises | More output can absorb existing fixed costs and use structural 300mm cost advantages | Economics depend more on external wafer pricing and negotiated capacity terms |
| Capital intensity | High | Generally lower |
This creates a different set of operating variables. TI can face higher depreciation as new fabs ramp, but it can also retain more of the benefit when higher volume moves through lower-cost internal production. The September letter becomes more economically interesting if selling prices hold while factory utilization and 300mm production increase at the same time.
300mm Capacity and the CapEx Cycle Add Another Variable
TI has spent heavily to build manufacturing capacity ahead of long-term demand. Capital expenditures reached $4.55 billion in 2025. In its 2025 annual filing, the company said it was nearing the end of a six-year elevated capital-expenditure cycle and expected to spend approximately $2 billion–$3 billion in 2026, with spending beyond 2026 increasingly tied to revenue and growth expectations. (Texas Instruments 2025 Form 10-K)
A lower annual CapEx level does not mean the cost of the manufacturing expansion disappears. New equipment creates depreciation, fabs need qualification and utilization can remain below optimal levels during ramp. The financial benefit comes when customer demand fills capacity that has already been installed.
That is why the relationship between demand and capacity deserves as much attention as the price adjustment itself. Higher selling prices offer limited help if new fabs remain lightly loaded. Stronger volume through an increasingly efficient 300mm base creates a different outcome.
Where the Wider Wafer and Foundry Cycle Fits
TI's internal manufacturing makes it less directly dependent on foundry allocation than a fabless chip company, but it does not isolate TI from the semiconductor manufacturing cycle. The September letter itself refers broadly to rising costs throughout the supply chain.
Silicon wafers, gases, chemicals, semiconductor equipment, packaging materials, outsourced production and subcontract assembly/test can all influence the economics of specific products. The weight of each factor varies substantially by MPN, which is another reason the September notice avoids one company-wide percentage.
The external foundry environment also provides useful context for pricing behavior across semiconductors. AI and high-performance computing continue to support tight advanced-node capacity, while selected mature-node products used in power management, automotive, industrial equipment and servers are seeing stronger utilization. Our analysis of TSMC capacity and returning foundry pricing power looks at that upstream part of the cycle.
The effect extends beyond leading-edge wafers. Automotive, industrial and networking products can remain dependent on mature manufacturing platforms that cannot be expanded or transferred quickly. We covered those constraints in Semiconductor Lead Times 2026: Why AI Demand Is Stretching Chip Supply Chains.
Upstream cost and capacity changes also take time to reach component buyers. Wafer utilization can tighten before manufacturer lead times extend; factory prices can move before distributor inventory is depleted; channel quotations can remain stable until older inventory is replaced at a higher cost. The transmission path is discussed in our 2026 semiconductor supply-chain pressure analysis.
What Could Prevent Pricing From Turning Into Better Economics?
The constructive operating signals need a counter-test. A price increase can protect a business from higher costs without improving profitability. TI explicitly cites rising supply-chain costs in the September letter, so some adjustments may be cost recovery rather than incremental pricing power.
The manufacturing model creates another risk. TI owns substantial capacity, which means a meaningful portion of operating cost is fixed. The company itself notes that low customer demand or low factory loading can hurt margins because those costs do not fall in proportion to unit shipments. Higher depreciation from new fabs can have the same effect while production ramps. (Texas Instruments 2025 Form 10-K)
| Risk to Watch | Why It Could Offset the Pricing Benefit | Evidence to Monitor |
|---|---|---|
| Price increases mainly offset cost inflation | Higher revenue per unit may not create higher profit per unit | Gross margin and operating-margin trend after repricing |
| Industrial recovery loses momentum | Industrial remains one of TI's largest and most important end markets | Sequential Industrial revenue and customer order trends |
| Automotive demand weakens | Lower utilization would reduce the benefit of internal manufacturing capacity | Automotive revenue and backlog direction |
| New fabs remain under-utilized | Depreciation and fixed costs continue even when output is low | Factory-loading commentary and margin progression |
| Customer resistance increases | Customers may shift new designs or qualify alternatives where substitution is practical | Order volume, design-win activity and pricing exceptions |
| Competitive pressure in China | Local analog and power suppliers can limit pricing flexibility in standard products | Regional pricing and product-mix commentary |
These risks are why the September notice should not be treated as a margin forecast. The more convincing evidence will come later, when TI reports whether stronger demand and factory loading continue while revised prices begin reaching customer shipments.
How Buyers Should Measure TI BOM Cost Exposure
For procurement teams, percentage increase is not the best way to rank the problem. Annual dollar exposure should come first. A small price change on a component used in very high volume can have a larger budget effect than a much larger percentage increase on a low-volume device.
| Illustrative Part | Annual Qty | Old Price | New Price | Increase | Annual Cost Impact |
|---|---|---|---|---|---|
| Part A | 1,000,000 | $0.12 | $0.13 | 8.3% | $10,000 |
| Part B | 20,000 | $8.00 | $8.80 | 10.0% | $16,000 |
Cost exposure should then be combined with engineering difficulty. A high-volume standard logic device with several qualified sources creates a different problem from a sole-source analog IC that would require a PCB change, firmware work or customer requalification. The most urgent items are usually those combining high annual spend, weak substitution options and limited inventory coverage.
What TI Buyers Should Confirm Now
The September letter leaves the decisive commercial details at MPN level. A useful internal review should combine pricing, backlog, supply coverage and engineering status in the same file so that cost decisions are not separated from supply risk.
| Check | Why It Matters |
|---|---|
| Exact affected MPN | Portfolio-level reports do not establish an individual BOM cost |
| Old and new price | Allows annual dollar exposure to be calculated |
| Effective date | The September letter does not give one universal implementation date |
| Order-date or shipment-date basis | Existing orders can be treated differently depending on the commercial rule |
| Open backlog | Accepted POs may or may not retain earlier pricing |
| Project pricing | Negotiated program pricing should be confirmed rather than assumed protected |
| Quote validity | Earlier quotations may no longer represent replenishment cost |
| 2027 forecast coverage | Annual budgets should include both new pricing and supply coverage |
| Approved alternative | A qualified second source can materially change the response to a price increase |
What the September 1 Letter Still Does Not Tell Us
Several details remain unresolved. TI has not published one portfolio-wide increase percentage, and the phrase "products across our portfolio" should not be read as confirmation that every TI MPN will increase.
The letter also does not give one universal effective date, explain how existing backlog will be treated or confirm whether the September communication is a separate pricing round from the October 1 adjustment already communicated to some customers. Product-specific dashboard notices will determine the real commercial effect.
The financial interpretation also remains open. Higher selling prices can support margins, offset inflation or do a combination of both. Factory utilization, depreciation, product mix and customer order volume will determine which effect is visible in later results.
Outlook: Pricing, Utilization and Cash Flow Need to Move Together
For component buyers, the next evidence is straightforward: the MPN-specific notification, the effective date and the treatment of existing orders. Those details determine whether a Q4 build or 2027 production plan actually changes.
For anyone tracking TI's operating cycle, a different set of indicators deserves attention. Demand has recovered sharply, operating profit is growing faster than revenue, free cash flow has improved, more customer business is direct, 300mm production continues to expand and the peak phase of annual capital spending is moderating. Product-level repricing now sits alongside those developments.
If customer demand keeps filling newer capacity while revised prices absorb supply-chain cost pressure, TI's manufacturing model has room to produce better unit economics. If demand weakens or new fabs remain under-utilized, the same internally owned capacity creates a larger fixed-cost burden.
The September letter is therefore more useful as one piece of a broader operating-cycle picture than as a standalone price-increase headline. The next few quarters will show whether volume, pricing and manufacturing efficiency continue reinforcing one another or begin to separate.
Key Takeaways
- Texas Instruments issued a customer pricing letter dated September 1, 2026 covering upcoming adjustments across products in its portfolio.
- TI did not disclose one company-wide increase percentage, a complete affected-MPN list or a new universal effective date.
- The September letter cannot yet be confirmed as a fourth independent 2026 TI price increase.
- TI says adjustments will vary according to product materials, technologies and manufacturing processes.
- Product-specific dashboard notifications make MPN-level pricing management increasingly important for TI customers.
- TI Q2 2026 revenue increased 23% year over year to $5.463 billion while operating profit increased 48%.
- Analog revenue increased 26%, Embedded Processing revenue increased 16%, and Industrial, Data Center and Automotive led the broader recovery.
- More than 80% of TI's 2025 revenue was direct, providing closer visibility into customer demand and pricing.
- TI says an unpackaged chip produced on a 300mm wafer costs about 40% less than one produced on a 200mm wafer.
- TI expects 2026 capital expenditures of about $2 billion–$3 billion after spending $4.55 billion in 2025.
- TI's internal manufacturing model makes rising demand and factory utilization especially important when interpreting the economic effect of price increases.
- Higher prices do not automatically mean higher margins because supply-chain inflation, depreciation, product mix and under-utilization can absorb the benefit.
- Buyers should rank affected TI products by annual dollar impact, supply risk and redesign difficulty rather than percentage increase alone.
- The strongest operating signal for the rest of 2026 will be whether demand, product-level pricing, 300mm utilization and cash generation continue moving in the same direction.